


Video Analytics Software: Metrics, Architecture, and ROI
Your uptime dashboard is green, yet viewers are abandoning playback. Support sees complaints, engineering sees successful HTTP requests, and product sees a retention dip—but nobody can connect those signals to the same video session.
The right video analytics software closes that gap. For an OTT service, it should reveal whether playback worked, how the experience varied by device and CDN, what viewers watched, where revenue leaked, and which fix deserves attention first. This guide gives technical and product buyers a practical framework for metrics, architecture, vendor evaluation, and ROI.
What is video analytics software?
Video analytics software collects, processes, and explains data about video playback, audience behavior, content performance, and monetization. In an OTT context, it turns player events and business data into session-level diagnostics, aggregate metrics, alerts, dashboards, and decisions.
The term is ambiguous, so define the use case before comparing products. Surveillance video analytics applies computer vision to camera footage to detect objects or activity. Sports analysis software tags plays and athlete performance. Marketing video analytics focuses on views, heatmaps, leads, and conversions. OTT video analytics must observe a continuous streaming session across players, networks, CDNs, DRM, ads, identity, and content.
Standard application monitoring cannot provide that complete picture. A manifest may return successfully while the player waits too long for its first decodable segment. Every segment request may return 200 OK while a weak connection repeatedly drains the buffer. Product analytics can record a play-button click without knowing whether the first frame ever appeared.
That is why streaming analytics needs both technical and business context:
- player state, errors, buffer, bitrate, resolution, and startup timing;
- device, operating system, app version, player, geography, ISP, and CDN;
- content ID, live or on-demand type, episode, channel, and rights window;
- anonymous or consented viewer and subscription attributes;
- watch time, completion, return behavior, conversion, churn, and ad events;
- delivery cost, support incidents, and revenue outcomes.
The CTA-2066 standard exists because inconsistent event names and metric definitions make cross-player and cross-vendor comparisons unreliable. A useful platform should either follow a shared vocabulary or document its own definitions precisely enough that your team can reproduce them.
The metrics video analytics software should measure
A dashboard with hundreds of charts can still fail to answer the basic question: did viewers get the experience and value they expected? Start with a compact metric tree that separates playback success, playback quality, engagement, monetization, and cost.
| Layer | Core metrics | Decision it supports |
|---|---|---|
| Playback success | attempts, successful starts, playback failure rate, exits before video start | Can viewers start the intended content? |
| Startup | time to first frame at p50, p95, and p99 | Which devices, regions, or services delay the first frame? |
| Smoothness | rebuffer ratio, rebuffer frequency, stall duration | Where does playback interrupt after it starts? |
| Visual quality | average delivered bitrate, resolution, upscaling, downscaling, quality switches | Is the player delivering appropriate quality for the screen and connection? |
| Engagement | watch time, completion, drop-off, active viewers, return rate | Does the content hold attention and bring viewers back? |
| Monetization | ad opportunities, fill, starts, quartiles, completions, subscription or purchase conversion | Where does viewing turn into—or fail to turn into—revenue? |
| Efficiency | CDN cost per viewing hour, bytes delivered, support contacts, incident minutes | What does each quality or engagement outcome cost? |
Playback success and exit before video start
Define a playback attempt from explicit viewer intent, not from a page load or an autoplay preview. Then define a successful start as the first rendered frame. The difference identifies viewers who tried to watch but never reached content.
Keep exits before video start separate from explicit errors. A viewer can leave during a long startup without the player throwing an error. Conversely, an error may be recovered automatically and never become a failed experience. Track both the technical event and the user-visible outcome.
Time to first frame
Time to first frame measures the interval between play intent and the first rendered video frame. It can include entitlement lookup, DRM licensing, manifest retrieval, CDN connection, initial segment download, decode, and rendering, so a single average hides important causes.
Report percentiles and dimensions. The median describes a typical session, while p95 or p99 exposes the slow tail that generates complaints. Break the metric down by app version, player, device class, network type, country, ISP, CDN, content format, DRM system, and live versus VOD.
Rebuffering and playback smoothness
Rebuffer ratio is commonly defined as total unintended stall time divided by playback time. Also track rebuffer frequency and the percentage of sessions with any rebuffering: one 10-second stall and five 2-second stalls produce the same total time but can feel different.
Exclude intentional pauses and seeking from stall calculations. For live video, distinguish normal buffer management from a failure to stay near the live edge. The ITU’s OTT QoE example highlights startup delay, rebuffering, playback failures, resolution drops, and end-to-end latency as user-centric indicators.
Delivered quality and adaptive bitrate behavior
Resolution alone is not a quality score. A 1080p label can hide an insufficient bitrate, and a high-bitrate rendition can waste bandwidth when rendered in a small window. Track delivered bitrate, rendition, viewport size, upscaling, downscaling, quality switches, and time spent at each rung.
Connect these signals to the logic described in an adaptive bitrate streaming architecture. If a device cohort constantly oscillates between two renditions, the cause may be an aggressive bitrate ladder, inaccurate bandwidth estimation, segment sizing, CDN performance, or player configuration. Analytics should help isolate that path, not merely report an average resolution.
Engagement and content performance
Watch time and completion are useful only when normalized for content type. A viewer completing a 90-second clip and watching 45 minutes of a two-hour match represent different behaviors. Compare episodes with similar duration and format, and separate live concurrency from VOD completion.
Adobe’s streaming media metrics documentation treats streaming metrics as event-driven counts and durations. That event foundation matters: business teams should be able to trace a completion rate back to consistent start, progress, pause, seek, and end rules rather than an opaque dashboard formula.
Ads, subscriptions, and revenue
For AVOD and FAST, instrument the full chain: ad opportunity, request, response, fill, start, quartiles, completion, error, skip, and return to content. A content session can look healthy while ad calls fail or ad stalls drive abandonment.
For SVOD and TVOD, join playback with entitlement and commerce events using privacy-safe identifiers. Compare trial conversion, paid retention, refund or cancellation behavior, and viewing depth by cohort. Do not claim that a playback metric caused churn from correlation alone; use controlled experiments or carefully matched cohorts when you change the player, CDN, ladder, or experience.
One score is useful; one score is not enough
An overall QoE score helps executives and operations teams see direction quickly. Mux, for example, describes an overall viewer experience score built from playback success, smoothness, startup time, and video quality.
Keep the components and raw session evidence available. A composite can improve while a small but valuable device cohort gets worse. Use the headline score to prioritize investigation, then diagnose with the underlying metrics and dimensions.
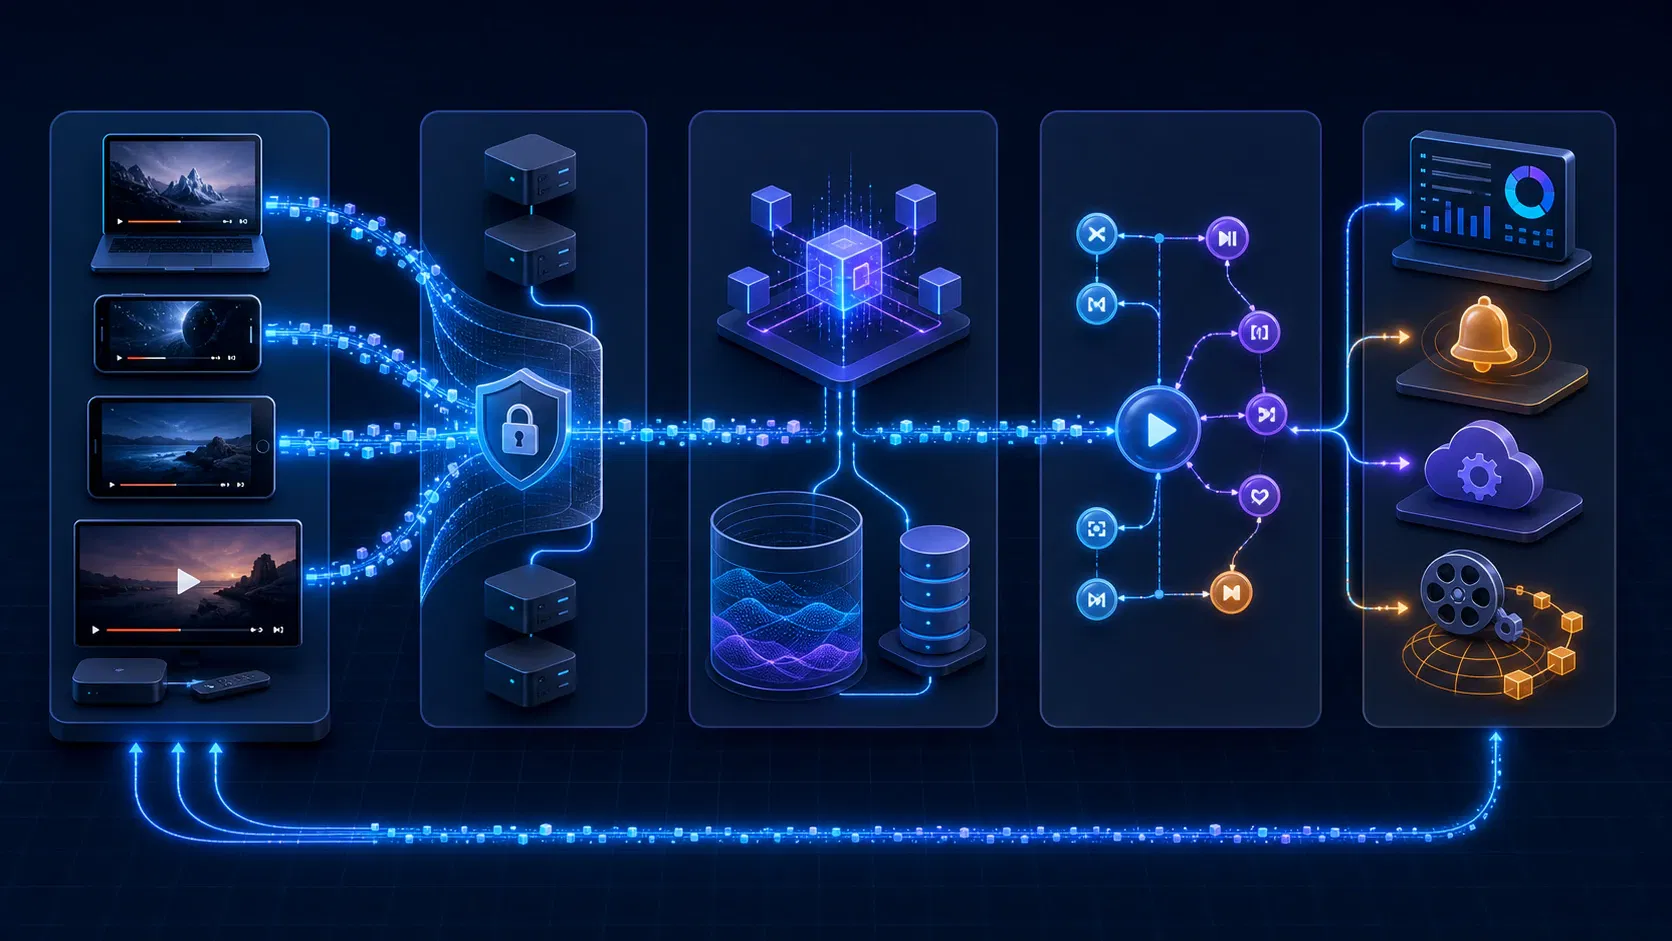
How video analytics software works: reference architecture
Reliable analytics is a data product, not an SDK pasted into a web player. The architecture has to preserve a session from the viewer’s device through ingestion, processing, storage, metric calculation, and action.
1. Collect events at the player
The player is the best place to observe viewer intent, rendered frames, buffer state, rendition switches, and recoverable errors. Instrument every supported surface: web, iOS, Android, Roku, Fire TV, Apple TV, smart TVs, set-top boxes, and game consoles where relevant.
Web players can expose events such as play, playing, waiting, seeking, ended, and error; the W3C media events reference illustrates the underlying browser event model. Native players expose different APIs, so a normalization layer must map platform-specific behavior into one event contract without erasing useful device details.
Every event should carry a stable session ID, event timestamp, sequence information, content ID, app and player versions, and the dimensions required for diagnosis. Avoid sending direct personal identifiers in raw telemetry when pseudonymous or aggregated values will meet the purpose.
2. Validate and ingest without blocking playback
Analytics must never sit on the critical playback path. Batch events locally, send asynchronously, retry with bounds, and cap resource use on constrained TV devices. The collector should survive intermittent connectivity without replaying the same event as if it were new.
At the edge or ingestion API, authenticate the application, validate the schema, reject or quarantine malformed events, deduplicate, timestamp receipt, and route data to a durable stream. Monitor the collector itself: event volume, delivery delay, dropped batches, schema versions, and duplicate rates are analytics health metrics.
3. Process real-time and historical paths
The real-time path computes active viewers, error spikes, startup degradation, and live-event health quickly enough for operations to act. The historical path produces durable session facts, content trends, cohorts, experiments, finance reporting, and model features.
AWS’s video advertising data-pipeline guidance separates ingestion, processing and enrichment, data modeling, and reporting. The specific services can change—managed streams, Kafka, object storage, a warehouse or lakehouse, stream processing, and BI—but the responsibilities remain useful.
Use idempotent processing and versioned schemas. Late or out-of-order events are normal on mobile networks and TVs. Decide how long a session remains open, how late data changes aggregates, and how backfills are communicated so yesterday’s number does not silently change.
4. Build a canonical session model
Raw events become useful when they resolve into a session with clear facts:
- play intent, first frame, end time, and end reason;
- startup duration and its component spans when available;
- total play, pause, seek, and unintended stall time;
- renditions, bitrate, resolution, CDN, and errors over time;
- content, device, app, geography, and privacy-safe viewer dimensions;
- ad, entitlement, experiment, and commerce joins;
- metric-definition and pipeline versions.
Store raw, minimally transformed events for a defined retention period and derived session tables for analysis. That gives engineers evidence for debugging while allowing business users to query stable, documented metrics.
5. Serve different users without creating different truths
Operations needs live alerts and session traces. Engineering needs error context, release comparison, and API access. Product needs funnels, cohorts, and experiments. Content teams need title, episode, and audience performance. Finance needs reconciled revenue and cost.
Give each team a suitable view over the same semantic layer. If every department independently defines a “view,” “start,” or “completion,” meetings become metric reconciliation instead of decision-making.
Where CMCD fits
Common Media Client Data lets compatible players send standardized client and object information with adaptive-streaming requests so CDNs and delivery systems can improve monitoring and optimization. The IETF’s operational guidance for streaming media also points to CTA-2066 and CMCD as interoperability mechanisms.
CMCD complements player analytics; it does not replace it. Request-level delivery signals cannot fully explain viewer intent, UI state, decoded frames, engagement, ad behavior, or subscription outcomes. Use a shared session identifier where practical so player telemetry and CDN logs can be correlated without exposing unnecessary identity data.
Data quality, privacy, and governance requirements
Bad instrumentation produces confident-looking fiction. Establish ownership and tests before teams depend on a dashboard.
Create a metric registry containing the name, definition, formula, unit, exclusions, dimensions, owner, source events, version, and update cadence. Add automated tests for event ordering, impossible durations, negative values, missing identifiers, duplicate events, sessionization, and reconciliation between raw and derived counts.
Release analytics changes like production code. Run old and new collectors together on a controlled cohort, compare event volume and key metrics, and annotate dashboards when definitions change. A player release that alters waiting behavior can create an apparent rebuffering improvement with no real viewer benefit.
Privacy design belongs in the schema. The European Commission’s GDPR principles overview emphasizes purpose limitation, data minimization, accuracy, storage limitation, and safeguards. Translate that into an event-by-event purpose, lawful basis review, retention schedule, access control, deletion process, regional handling, and vendor contract—not a generic privacy checkbox.
Also verify consent behavior for advertising and personalization, encryption in transit and at rest, role-based access, audit logs, data export, and incident response. Session replay or detailed viewer-level history deserves stricter access than aggregated QoE trends.
Buy, build, or combine video analytics software
There are three practical patterns. The right choice depends less on total viewers than on player diversity, operational urgency, data-team capacity, customization, and the cost of lock-in.
| Pattern | Best when | Advantages | Trade-offs |
|---|---|---|---|
| Managed analytics platform | You need fast, proven QoE visibility and a small operating burden | Player collectors, dashboards, alerts, benchmarks, session diagnostics | Usage cost, fixed metric model, retention limits, vendor dependency |
| Managed collection plus your warehouse | You want quick instrumentation and control of long-term analysis | Faster start, exportable events, custom BI and business joins | Two systems to govern, egress or export cost, reconciliation work |
| Custom collection and analytics | Metrics are a strategic differentiator and you have data-platform expertise | Full control of schema, retention, joins, automation, and unit economics | Longer delivery, on-call ownership, device SDK work, ongoing data quality burden |
Do not frame the decision as a permanent binary. Many OTT teams start with a managed product, export normalized events to a warehouse, and custom-build only the metrics or automations that differentiate the business. Require a tested export path so future change does not force every player to be re-instrumented.
For media companies that need analytics integrated with the player, DRM, CDN, monetization, and owned data stack, Apexnova can design that layer as part of an end-to-end OTT platform build. The useful outcome is not another dashboard; it is a shared telemetry model that engineering, product, content, and revenue teams can act on.
How to evaluate video analytics software
Evaluate evidence from your own streams, devices, and questions. A polished demo built on web VOD traffic says little about a Roku live event with server-side ads and DRM.
Start with five decision questions
- Which decisions must improve? Name incidents, release gates, content decisions, monetization problems, or cost controls—not vague “insight.”
- Which sessions are hardest to observe? List players, operating systems, devices, countries, CDNs, DRM, live formats, and ad modes.
- Which metrics must be reproducible? Ask for definitions, raw or session-level evidence, percentile support, filters, APIs, and export.
- How quickly must the team act? Live operations may need seconds or minutes; content and retention analysis may tolerate daily processing.
- What happens when you leave? Test data ownership, historical export, collector removal, schema portability, and contract terms.
Score the capability, not the feature label
Use a weighted scorecard covering:
- collector coverage and maintenance for every production player;
- live, VOD, low-latency, DRM, client-side ads, and server-side ads;
- transparent metric definitions and version history;
- session traces, error context, dimensions, percentiles, and cohorts;
- real-time freshness, alert controls, anomaly detection, and on-call integrations;
- API, raw data export, warehouse destinations, and retention;
- privacy, regional data handling, access control, deletion, and auditability;
- implementation effort, SDK overhead, support, and total cost;
- vendor stability and a credible exit path.
AI can help summarize sessions, detect anomalies, and suggest likely causes, but it is not a substitute for sound telemetry. Ask the vendor to show the source events and dimensions behind an AI recommendation. If a conclusion cannot be inspected or tested, treat it as a lead for investigation rather than an automated decision.
Run a production-like proof of concept
Instrument at least one high-volume surface and one difficult surface. Include real app versions, representative geographies, a live stream if live matters, DRM, ads, and at least two CDNs if you use multi-CDN delivery.
Plant known failures: delay the license response, return a manifest error, throttle a device, force a CDN problem, create an ad timeout, and ship a tagged test release. Measure whether the platform detects the issue, identifies the right cohort, shows a usable session trace, alerts without noise, exports the data, and helps a teammate reach the correct cause.
Do not score only dashboard accuracy. Record integration hours, app-size or runtime overhead, event loss, time to detect, time to isolate, false alerts, query latency, analyst effort, and vendor-support responsiveness.
Calculate ROI without inventing an uplift
Video analytics creates value through avoided loss and better decisions, not through page views on a dashboard. Build the case from a measured baseline and keep benefit categories separate to avoid double-counting.
Annual ROI = (incident value protected + support cost avoided + delivery cost saved + incremental contribution) − annualized software and operating cost
Estimate each component with your own data:
- Incident value protected: affected session-minutes × contribution per session-minute × reduction in detection and recovery time.
- Support cost avoided: playback-related contacts avoided × fully loaded cost per contact.
- Delivery cost saved: viewing hours shifted to a more efficient CDN or rendition × verified unit-cost difference.
- Incremental contribution: additional retained or converted viewers × contribution per viewer, adjusted for experiment confidence.
- Annualized cost: license, event overages, implementation, SDK maintenance, storage, data egress, dashboards, on-call, and analyst time.
Suppose a team wants to justify better CDN diagnostics. First measure incident frequency, affected sessions, mean time to detect, mean time to isolate, delivery cost, and contribution per completed session over a representative period. During the pilot, compare those same measures for instrumented traffic. Do not multiply an observed improvement across all traffic until the sample covers the same devices, regions, content, and seasonality.
For cost optimization, compare quality and spend together. Routing traffic to a cheaper CDN is not a saving if startup or rebuffering worsens. A valid test shows the cost difference while holding an agreed QoE guardrail, and it identifies which regions or device cohorts should not move.
Use a 30-day pilot scorecard with baseline, target, observed result, data confidence, owner, and financial assumption for every benefit. The final decision should show a range—conservative, expected, and upside—not one precise forecast built from weak attribution.
A practical 90-day implementation plan
Days 1–15: define the contract. Select the five to ten decisions that matter, document metric definitions, map players and data sources, complete privacy review, and choose a representative pilot cohort.
Days 16–35: instrument and validate. Add collectors, stable session IDs, schemas, and release tags. Reconcile test sessions manually, verify timestamps and event ordering, and measure delivery loss and SDK overhead.
Days 36–55: build operational views. Create playback-success, startup, rebuffering, error, live-event, and release dashboards. Alert on service-level symptoms with cohort context; avoid one threshold for every device and region.
Days 56–75: join business outcomes. Connect privacy-safe content, entitlement, ad, subscription, and cost data. Establish cohort and experiment methods before attributing retention or revenue changes.
Days 76–90: prove action and ownership. Run failure drills, document incident playbooks, train each team on its view, review access and retention, calculate pilot economics, and decide whether to expand, rework, or stop.
Treat instrumentation as part of release quality. Your OTT testing process should verify analytics events and definitions alongside playback, DRM, ads, and device behavior so a “successful” release cannot silently blind the organization.
Frequently asked questions
What is video analytics software used for?
Video analytics software is used to measure playback success, streaming quality, audience engagement, content performance, monetization, and delivery efficiency. OTT teams use it to detect incidents, diagnose affected sessions, compare releases and vendors, improve content and product decisions, and connect viewing outcomes to cost or revenue.
Which video analytics metrics matter most for OTT?
Start with playback success, exit before video start, time to first frame, rebuffer ratio, playback failures, delivered quality, watch time, completion, and active viewers. Add ad, subscription, entitlement, CDN-cost, and support metrics according to the business model, then segment the results by device, app version, geography, ISP, CDN, and content.
How does video analytics software collect data?
It usually instruments web and native players with a collector or SDK, sends asynchronous session events to an ingestion service, and processes them into real-time and historical metrics. Mature systems preserve raw evidence, normalize player differences, enrich events with technical and business dimensions, and serve dashboards, alerts, APIs, exports, and automations.
Can Google Analytics replace OTT video analytics software?
No. General product analytics can measure navigation, campaigns, and conversion events, but it does not natively explain buffer state, first-frame rendering, adaptive bitrate decisions, DRM timing, rendition changes, or session-level playback failures. The two systems are complementary when joined with privacy-safe identifiers and consistent definitions.
How much does video analytics software cost?
Cost depends on video starts or events, monthly viewing volume, retention, player and module coverage, real-time requirements, exports, support, and contract minimums. Compare total annual cost, including implementation, data egress, warehouse and BI spend, SDK maintenance, internal operations, and exit cost—not only the vendor’s base fee.
Should an OTT platform build or buy video analytics?
Buy when fast visibility, proven collectors, and lower operating burden matter most. Build when the telemetry model, business joins, automation, retention, or economics are strategic and the team can own player SDKs and a production data platform; a managed collector plus owned warehouse is often a practical middle path.
Does video analytics software need AI?
No. Accurate events, reproducible metrics, useful dimensions, and reliable alerts create value before AI is added. AI can accelerate anomaly detection and investigation, but teams should be able to inspect the underlying sessions and test any recommended action.
Choose the decision system, not the biggest dashboard
Select video analytics software by working backward from decisions: the incidents you must shorten, the viewer cohorts you cannot see, the business outcomes you need to improve, and the data you must retain or export. Then verify the platform on your hardest player and stream, with planted failures and a baseline that makes ROI auditable.
A credible choice will give operations faster evidence, engineering reproducible sessions, product trustworthy cohorts, and finance a defensible connection between quality, cost, and contribution. Use the 30-day proof-of-concept scorecard before signing a long contract or committing to a custom build, and expand only when the system proves that teams can act on what it measures.